
Images & Infographics
The pictures behind the articles
Maps you can explore and charts you can read the values from, each made from the same figures as the article it belongs to.
All graphics
5 pieces Interactive map
Companies · Sectors
Crest Nicholson: UK development map
Every Crest Nicholson site on one map.
 Interactive map
Companies · Consumer Spending
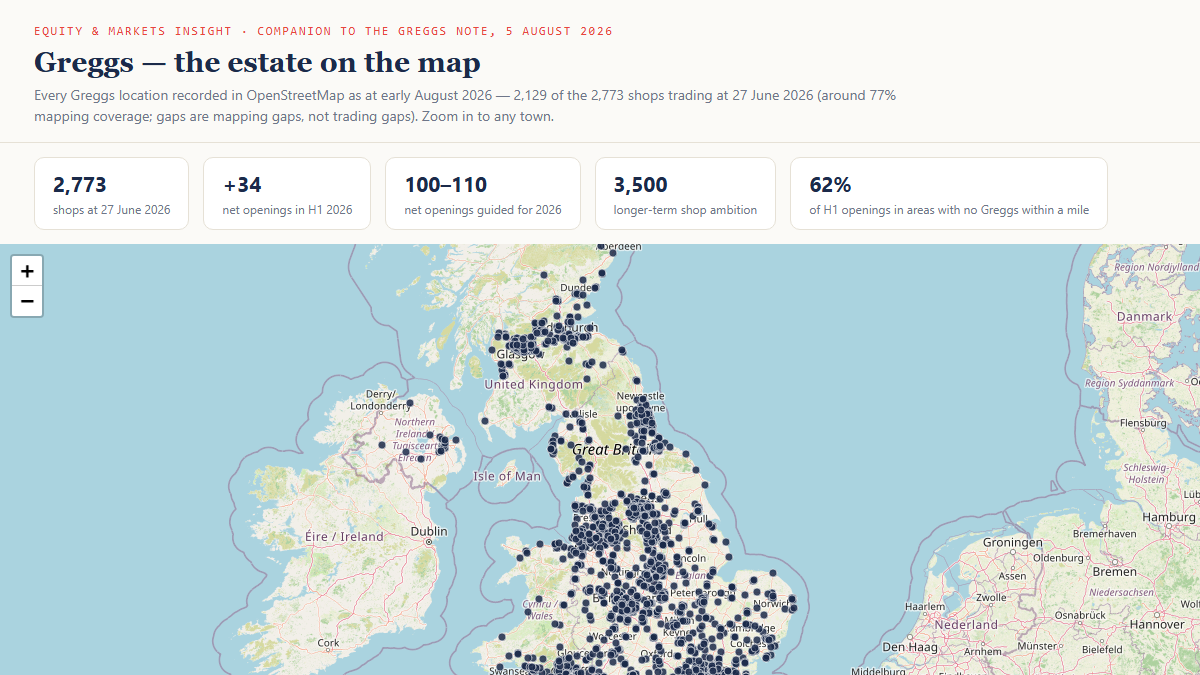
Greggs: the estate on the map
Every mapped Greggs shop, zoomable to any town.
 Chart
Macro · Inflation and Interest Rates
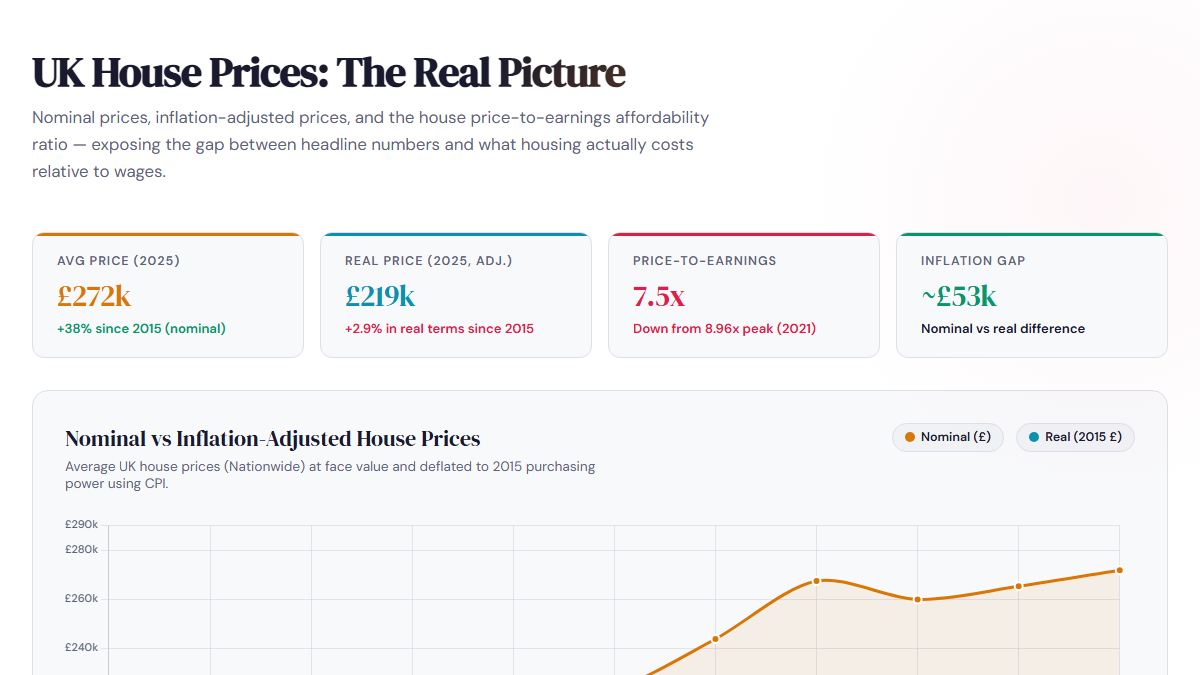
UK House Prices: The Real Picture (2015 to 2025)
Nominal against inflation-adjusted prices and affordability.
 Interactive map
Commodities · Macro
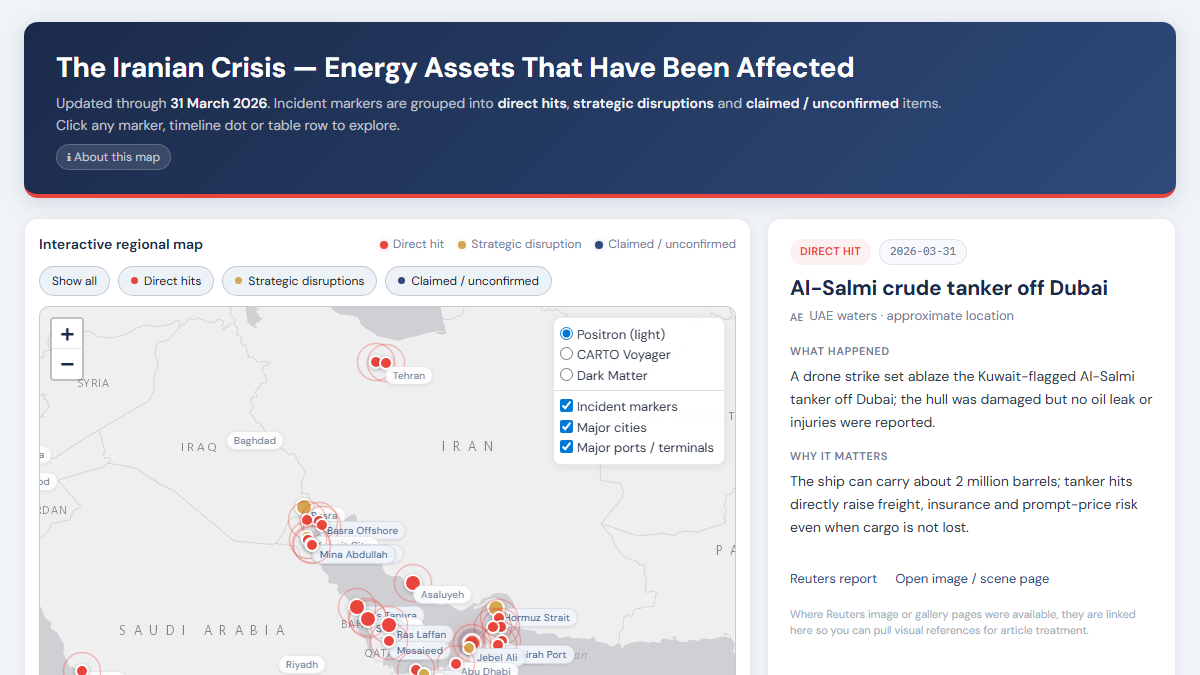
The Iranian Crisis: Energy Assets Affected
Interactive map of strikes and disruptions to regional energy assets.
Premium
The data behind each graphic
Premium members can download the figures every chart and map is drawn from, as spreadsheet files that open in Excel.
Sign in to download.
Strait of Hormuz: Tracking the Ships
- Daily transits: total, tankers and cargo ships
- Daily transits by direction
- Daily counts reported in the press, with the source
- Transits by period of the crisis
Crest Nicholson: UK development map
- Every development with its town, region and status
Greggs: the estate on the map
- Latitude and longitude of every mapped shop
UK House Prices: The Real Picture (2015 to 2025)
- Prices, inflation, affordability and transactions by year
The Iranian Crisis: Energy Assets Affected
- Every incident with its date, place and source
Same numbers as the article
Every graphic is built from the figures in the piece it accompanies.
Built to be explored
Zoom the maps to any town or site, and hover or tap for the values.
Free to view, free to share
Each graphic has its own page and link.